Production of Boolean Images
In order to perform both the Boolean Overlay and the Weighted Linear Combination analyses, the variables of protected watershed, open water bodies, and protected parks/forests must be converted into a Boolean image format. This allows the production of distance images which used later, eventually leading to the output of the final image using both methods of spatial analyses.
Please refer to the cartographic model of MCE - Boolean Overlay approach for the reclass parameters used to create each boolean image.
The following 3 Boolean images were created using RECLASS in Idrisi and using the LANDUSE.rst image as the input file:
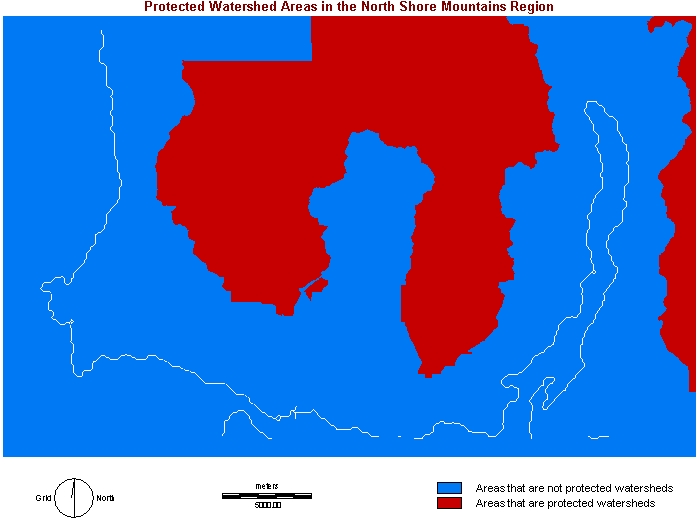
Boolean Image 1: Protected Watersheds
This involves the production of a raster image called WATERSHEDBOOL.rst. The image was created by reclassing areas from protected watershed areas to all other areas using LANDUSE.rst as the input image file. According to the image below, areas indicated in red show areas of protected watersheds (cannot be considered for urban development at all). Areas indicated in blue show areas that are not protected watersheds (potential land for urban development?).
Image shown below is WATERSHEDBOOL.rst:
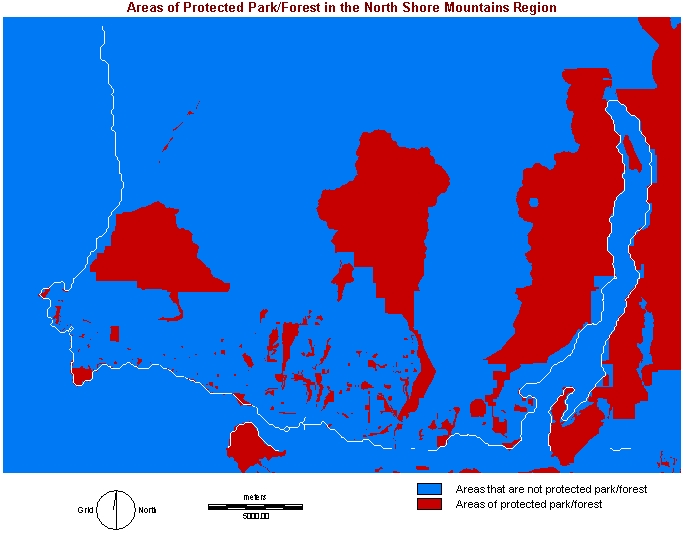
Boolean Image 2: Protected Parks/Forests
This involves the production of a raster image called FOREST_PARKBOOL.rst. The image was created by reclassing areas from protected areas to all other areas using LANDUSE.rst as the input image file. According to the image below, areas indicated in red show areas of protected park/forest (cannot be considered for urban development at all). Areas indicated in blue show areas that are not protected park/forest (potential land for urban development?).
Image shown below is FOREST_PARKBOOL.rst:
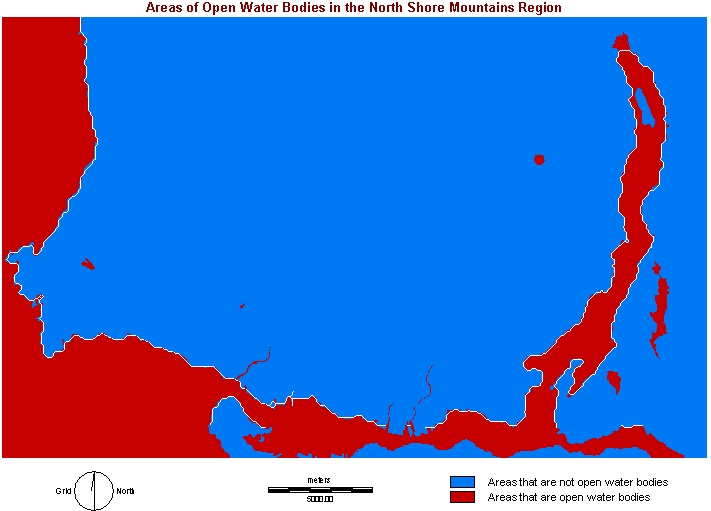
Boolean Image 3: Open Water Bodies
This involves the production of a raster image called WATERBOOL.rst. The image was created by reclassing areas of open water bodies from all other areas using LANDUSE.rst as the input image file. According to the image below, areas indicated in red show areas of open water bodies (cannot be considered for urban development at all). Areas indicated in blue show areas that are not open water bodies (potential land for urban development?).
Image shown below is
WATERBOOL.rst:
Please click here
for Data Preparation and Manipulation - Distance/Slope
Images (3.5)
Or click here to go back to main menu